To keep our community informed about local air quality, we use data from PurpleAir monitors placed throughout the region. These sensors measure fine particulate matter (PM2.5), which can impact respiratory health, and provide near real-time updates.
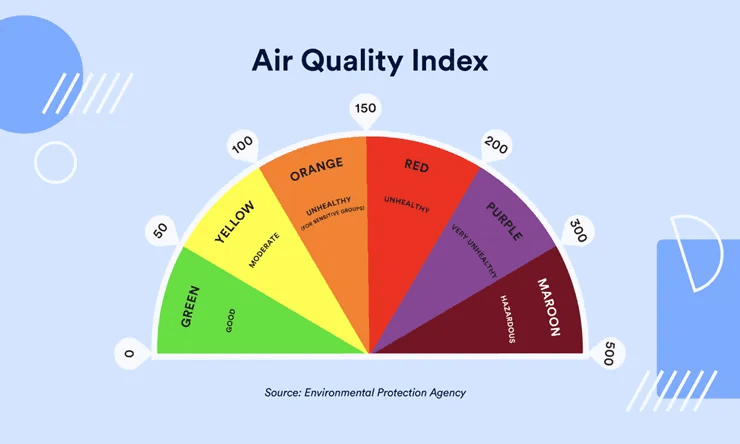
The map shows color-coded sensors based on the U.S. EPA Air Quality Index (AQI), making it easy to see air quality across the community.
Click on any sensor to view detailed data and trends to help guide outdoor activities and health decisions.
You can view current air quality conditions anytime on the PurpleAir interactive map at